
Months are listed chronologically from left to right (January to December).
fig. 8 – graph of the precipitations and temperature in the area of Rockall: blue column shows the average quantity of the precipitations in 10s mm per month; the orange line shows the temperature of the water by the sea-level in °C; the red line show the temperature of the wind by the sea-level in °C (according to Atlas okeanov, 1977)
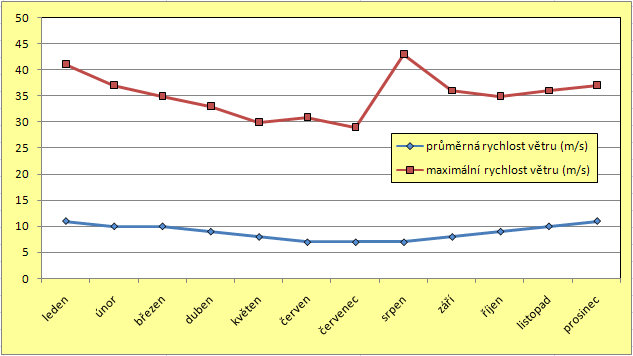
fig. 9 – graph of the wind-speed in the area of Rockall: red line shows the maximum (m per second); the blue line shows the average (according to Atlas okeanov, 1977)